![]()
Repeated-Measures ANOVA with three or more trials plus a between-subjects effect
|
A New View of Statistics | |
|
|
Repeated-Measures ANOVA with three or more trials plus a between-subjects effect |
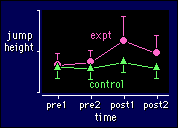 You should be able to see that this model
is the previous two merged together. The interpretations of the main effects and
interaction term from the first of the previous models (two
time points, two groups) still apply. And all the problems with sphericity
from the model on the previous page (three or more
trials in one group of subjects) still have to be addressed.
You should be able to see that this model
is the previous two merged together. The interpretations of the main effects and
interaction term from the first of the previous models (two
time points, two groups) still apply. And all the problems with sphericity
from the model on the previous page (three or more
trials in one group of subjects) still have to be addressed.
To summarize:
If you didn't know any better, you might try to analyze these data
by doing a series of unpaired t tests for each time point. That would
be foolish, for three reasons: the power to detect differences would
be lousy, because you would not be making use of changes in each
subject's values; you would not be taking into account any
differences between the two groups at baseline; and finally you would
not impress the reviewers and editor of the journal you submit the
research to. You could fix the first two criticisms by subtracting
each subject's mean baseline value from the post1 and post2 values,
then doing unpaired t tests on these difference scores.
Special Case: Multiple Crossovers and
Latin Squares
Recall that a
simple crossover is a design in which
all subjects receive two treatments. We analyzed the data with a treatment effect
and a group effect that indicated which treatment each subject got first:
model:
numeric <= (subject) treat group treat*group
example:
jumphgt <= (athlete) treat group treat*group
OK, but what about more than two treatments? For example, can we have a crossover in which every subject gets a control treatment and two experimental treatments aimed at increasing jump height? Sure, just use the above model. Treat is the repeated-measures or within-subject effect, with three or more levels. The group effect represents the sequence of treatments that each subjects is assigned to, and it also has three or more levels, as we'll see. And in the same manner as for a simple crossover, with SAS you can use a trial effect instead of a group effect to indicate whether each treatment was first, second, third... for each subject (see earlier):
model: numeric <= (subject) treat trial treat*trial
Whichever model you use, the good news is that you still need only about a quarter of the subjects of a fully controlled study! Here's how to set up and analyze these multiple crossovers.
First, randomize your subjects to the various sequences of treatments. For example, if you have two experimental treatments (A and B), and a control treatment (C), there are six possible sequences: A-B-C, A-C-B, B-C-A, B-A-C, C-A-B, and C-B-A. It's best to use all these sequences, because if one of the treatments has a carry-over effect, it will affect all the other treatments equally.
Next, decide on sample size. By running a simulation for this design, I've found that about 12 subjects give acceptable confidence limits for the pairwise comparisons of the treatment effects, for very high reliability (r=0.95). So you could start with two subjects doing each of the six sequences of treatments, then do more subjects if necessary, as described in sample size on the fly. If one or two subjects miss a treatment, or if you lose one or two subjects completely, no great problem: the data don't have to be "balanced" to give unbiased estimates, provided none of the treatments carry over.
Now do the work, get the data, and analyze them. If you can use proc mixed in SAS, I recommend the crossover model with trial: it gives slightly better confidence intervals, and it's easy to estimate the learning effects from the levels of the trial effect (e.g. for three treatments there's one learning effect between first and second trials and another between second and third trials). See the simulation for the program statements. Non-SAS users will have to use the usual crossover model with a group effect, but it's fiendishly difficult to work out the appropriate combination of levels of treat*group to get the learning effects.
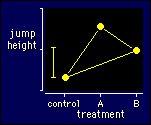 How best to plot data for a multiple
crossover? For a simple crossover I suggested showing the means for
the two groups of subjects for control and experimental treatments.
That approach is no good for multiple treatments, because there'll be
too many groups and not enough subjects in each group. One solution
is simply to plot the means for each treatment. Connect all the
points together, as I have done in the figure, to show they all have
the same repeated-measures relationship to each other. Or if the
treatments can be put into a sensible order, such as an increasing
dose of something, plot the treatments in order along the X axis and
connect the points sequentially. Either way, you shouldn't use a bar
graph.
How best to plot data for a multiple
crossover? For a simple crossover I suggested showing the means for
the two groups of subjects for control and experimental treatments.
That approach is no good for multiple treatments, because there'll be
too many groups and not enough subjects in each group. One solution
is simply to plot the means for each treatment. Connect all the
points together, as I have done in the figure, to show they all have
the same repeated-measures relationship to each other. Or if the
treatments can be put into a sensible order, such as an increasing
dose of something, plot the treatments in order along the X axis and
connect the points sequentially. Either way, you shouldn't use a bar
graph.
Standard deviations are a problem with multiple crossovers. You could plot the standard deviations for each treatment, but they will be inflated by any learning effects. Stats wizards using proc mixed in SAS can extract the composite between-subject SD from the ANOVA. This SD includes within-subject retest error, but it is not affected by the treatment and learning effects. It's therefore the best measure of variation by which to assess visually the magnitude of the treatment effects shown in your plot.
In the text of the Results section, give the raw differences
between the means for the treatments and the confidence intervals for
these differences. Or when appropriate (e.g. for most athletic
performance measures), show percent differences and their confidence
intervals, as provided by analysis of
log-transformed performance measures.
When there are four treatments altogether (e.g. a control and three
experimental treatments), there are 24 possible sequences of
treatments. You could randomize one subject to each sequence of
treatments, but you might not need 24 subjects to get acceptable
confidence limits for your comparisons. But with random assignment of
less than 24 subjects, you might not end up with balance in the way
treatments follow each other. A problem if one of the treatments has
a carry-over effect, because it will have the greatest effect on the
treatment that follows it most times. So it's better to randomize to
a subset of sequences that ensures every treatment follows every
other treatment the same number of times. Any carry-over effect will
then affect every other treatment equally. Such a balanced subset of
sequences is called a Latin square. Here's the Latin-square
set for four treatments, A, B, C, and D:
Sequence 1: A B C D
Sequence 2: B D A C
Sequence 3: D C B A
Sequence 4: C A D B
Check and you'll see that each treatment follows every other treatment only once. Your sample size obviously has to be a multiple of 4 to keep the balance. For example, for 12 subjects, assign three at random to each of the four sequences.
Here's a balanced set of sequences for five treatments. In this case you need 10 sequences to keep the balance (and each treatment is followed by every other treatment twice), so you'll need multiples of 10 subjects in your study:
1: A B C D E 6: E D C B A
2: B D A E C 7: C E A D B
3: D E B C A 8: A C B E D
4: E C D A B 9: B A D C E
5: C A E B D 10: D B E A C
We're into seldom-trodden territory now, but I must record the trick of generating these Latin squares, in case you want to do more than five treatments. Instead of labeling the treatments with letters (A, B, C...), let's label them with numbers (1, 2, 3...). Assume n treatments. Here is the Latin square for n even. As above, the sequences of treatments are given by the rows, not the columns:
1 2 n 3 n-1 4 n-2 . . 2 3 1 4 n 5 n-1 . . 3 4 2 5 1 6 n . . . . . . . . . . . . . . . . . . . .
For n odd, use the above set of sequences, plus its mirror image.
Check out the sets for five treatments given above, to see what I
mean. Thanks, Dennis
Loiselle!
Go to: Next · Previous · Contents · Search
· Home
editor
Last updated 11 May 98